
Linking thoughts and connections in visual ways can help you move into deeper levels of thinking.
Creating diagrams and other visual representations encourages you to step away from the reading and to organize your information and ideas in novel and meaningful ways.
Visual representations help you juxtapose ideas and bring to light interesting connections that might be incorporated into a broader plan for the essay.
Review the sections below to examine ways of visually representing your notes. Also refer to the Mind Mapping and Concept Mapping templates located under Resources for Gathering & Noting Ideas.
In the early stages of working on a written assignment you might create a mind map. Starting from a central theme, elements branch out to show relationships among aspects of a topic.
The process of creating a mind map forces you to consider the relationships among ideas and aspects of the topic. By asking yourself questions about these relationships, you deepen your understanding of the materials. It is the process of questioning as much as the final map that helps you build the structure and/or arguments for your paper.
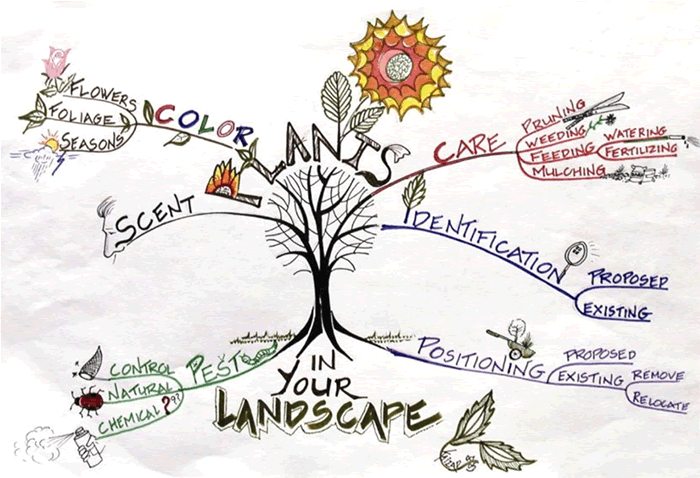
Source: Irani, K.R. (Artist). (n.d). Plants in Your Landscape – Mind Map [Image]. Retrieved from Kaizad R. Irani, Program Director, Horticulture and Landscape Design, Parkland College.
The process of creating a comparison chart can reveal similarities and differences among concepts, ideas, theories, perspectives and more.
A comparison chart can help you organize information by comparing and contrasting aspects of a topic.
How does connectivism compare to other learning theories?
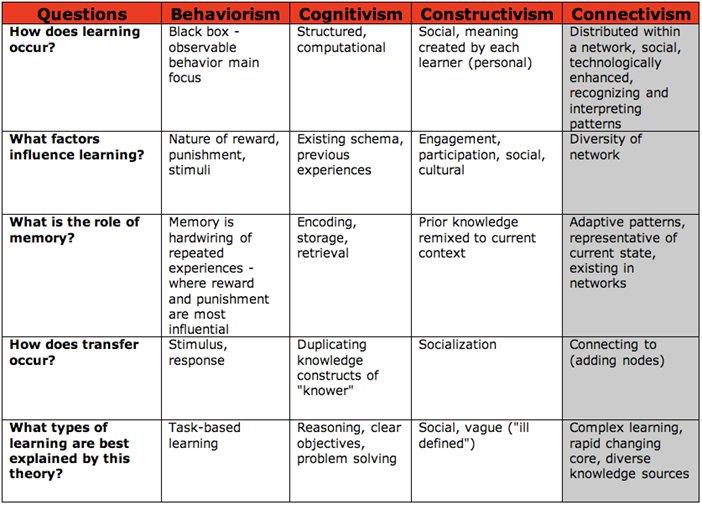
Source: Ireland, Tim. (2007) Connectivism. Retrieved online at http://etec.ctlt.ubc.ca/510wiki/Situating_Connectivism.
You might create a more structured concept map to visually represent hierarchical connections and relationships you have noted among readings, theories or processes.
For example, use:
Most important for deepening your understanding of the material is to place connector words on the lines or arrows to communicate the relationships between concepts (e.g., “is an example of”, or “is evidence for”).
Source: Ruíz-Primo, M. (2000). On the use of concept maps as an assessment tool in science: What we have learned so far. Revista Electrónica de Investigación Educativa, 2 (1). Retrieved November 27, 2012: http://redie.uabc.mx/vol2no1/contenido-ruizpri.html
A timeline organizes related information in chronological order. It can help you understand the sequence of unfamiliar events. Plotting events on a timeline or placing two timelines together can reveal patterns or themes that may be otherwise difficult to identify.
Timelines can be based on many kinds of information, for example biographical data, cultural periods, scientific discoveries, etc.
Timeline of the North American Imperial Wars from 1690s – 1760s
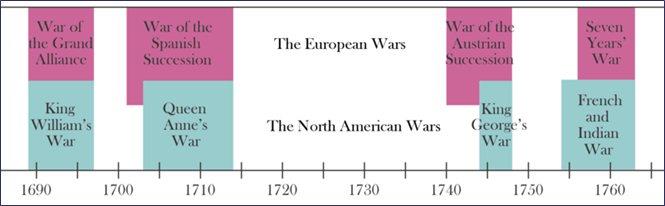
Source: Nonenmach, R. A. (2006). Timeline of the North American Imperial Wars from 1690s – 1760s. Retrieved online at http://en.wikipedia.org/wiki/French_and_Indian_Wars.